Until now Atomic Scope offered exception monitoring which notified you as soon as there was a problem processing a message. Since then we have received a lot of requests to provide an option to monitor the results of queries. The team has revised this feature request and decided it will be an excellent candidate for our next release. In this blog, we will be looking at query alert and how it can be used to solve yet another of your integration problems.
Problem and Solution
There is no denying that it is important for any business to ensure that their solution is working as expected. One such indication is the SLAs in form of message volume, transaction success rate, etc. Therefore, the owners of these integrations must be are aware of any problems before it negatively impacts the business. With Atomic Scope query alert you will be able to verify all these factors and notify when needed.
With exception alert we have the peace of mind that whenever there is a failed message processing, correct people will be informed, the issue can be investigated and rectified. However, even if there are no errors in the processing, it does not necessarily mean the system is working correctly. For many businesses, it is important that they monitor the volume of data. Regardless of business type, there will always be some expectation level of data coming from the source system. Performing this check manually every day, week or month can be a monotonous job and of course, it is prone to human errors. Let us look at how Atomic Scope can solve this problem for you, allowing you to focus on other tasks, while you have the peace of mind that if anything goes wrong you will be the first person to know about it.
Get Notified
Additionally, we decided that it will be a good idea to provide more means of notifications for our monitoring capability. In the earlier release with Exception monitoring the only available channel was e-mail. Despite the fact that it is the most common way of communication across businesses, there are other collaboration tools for internal teams that are being utilized and offer better message segregation, which in return allow for faster response to the problem. Thus, for those customers that can utilize the power of the internet on their Atomic Scope machines, we have introduced external notification channels.
Search Query
For those of you that have upgraded Atomic Scope, you will see that the “Diagnostic” section was renamed to “Monitoring”. From now, this is where all sections related to the health of Atomic Scope and your integration will be located.
To make the configuration easier begin by going to the tracking page and construct the desired query. This page provides search helpers that make the query construction easier and re-usable in monitoring and searching. The query I have constructed looks for a specific transaction within one of my business processes.
Process = "Kovai.Sales" and Transaction = "SingleOrchestrationScenario"
The query is exactly what I need, however, you can add more filters to the query to suit your needs. To save the query, just click on the Save icon located right above the search button.
We have the query the next step is to create the alert to monitor the output count of that query.
Creating Query Alert
To create a query alert navigate to alert page via
AtomicScope -> Monitoring -> Alert -> Query Alert (Tab)
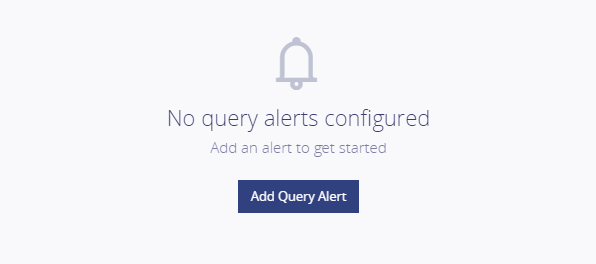
Click “Add Query Alert” button to load the configuration page. The configuration layout is like what you can see in the business process configuration page. Right at the top, you can provide a friendly name that describes what does the alert monitor. It is a good practice to provide a meaningful name that will clearly explain the alert purpose. This could lead to confusion and removal of important monitoring alert.
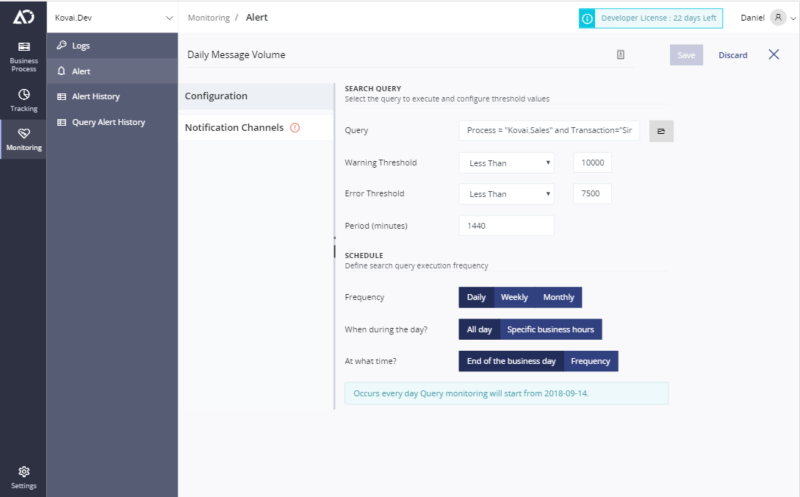
The next step is to enter the query you want to monitor or select one of the saved queries using the Open icon button found at the end of the input. Time to set our expectations by providing the threshold values. Right in the beginning, we talked about the expected volume of data coming from the source system and that is what we want to achieve in our new alert. I have set my threshold operators to “Less Than”, then the values to 10,000 in warning and 7,500 in error.
Now if my query returns less than 10,000 rows the monitoring service will send me a warning alert, but if it falls below 7,500 then it will trigger an error. The last parameter for the query is the period of data that we want to fetch from the point of execution. The value must be provided in minutes, so in my case, we want to monitor a full day. A full day is 1440 minutes and that is the value I am going to enter.
Schedule
You need a schedule to trigger query alert, unlike exception alert which is triggered by an exception event. Therefore, we need to let it know how often it needs to run the query. As already mentioned I care about my daily data, so the first input stays at “Daily” which is the default value. In the next section, I am also keeping the default value as I want to monitor the entire day, not specific business hours. Lastly, I am also keeping the default value as I want to evaluate the whole day at the end of the day.
Neatly, at the end of the configuration options, I have an information box which clearly explains my scheduling configuration giving me an idea on how the query alert will be executed.
We have tried our best to make the configuration as simple as possible, if you need more detailed information about any of the inputs please head over to our documentation page.
Notification Channels
The final step is to choose the notification channels that you want to trigger in case of threshold violation. Click on “Notification Channels” from the menu on the left and enable the channels. The built-in email notification requires you to enter the list of emails that will receive the notification.
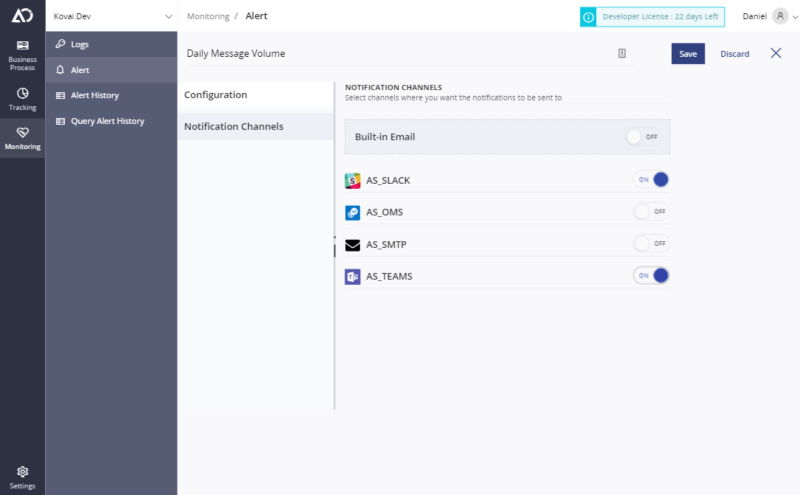
Currently, we support 6 Notification Channels:
- Webhook – Send Notification in a JSON or XML format to any specified format using POST / PUT
- SMTP – Send Email with any importance to a group of people To, BCC, CC
- Slack – Create a new channel for Atomic Scope and deliver notifications right there without cluttering your core channels
- PagerDuty – is your support team relying on PagerDuty tickets? Atomic Scope can send notifications right there, so correct people can act when needed.
- Operations Management Suite (OMS) – if you use Log Analytics to monitor your solution and that is where you spend most of your time. Atomic Scope will send all send notifications to OMS.
- Microsoft Teams – Create a new channel for Atomic Scope and deliver notifications right there without cluttering your core channels
You will find all the information about how to configure all those channels in our documentation page right here
Execution
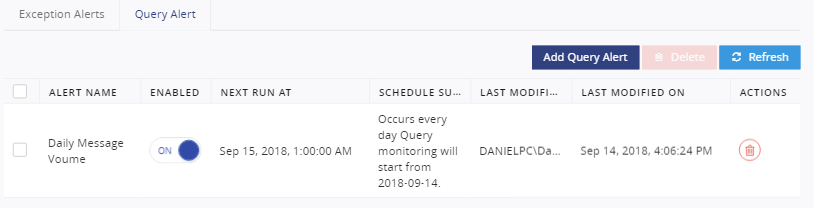
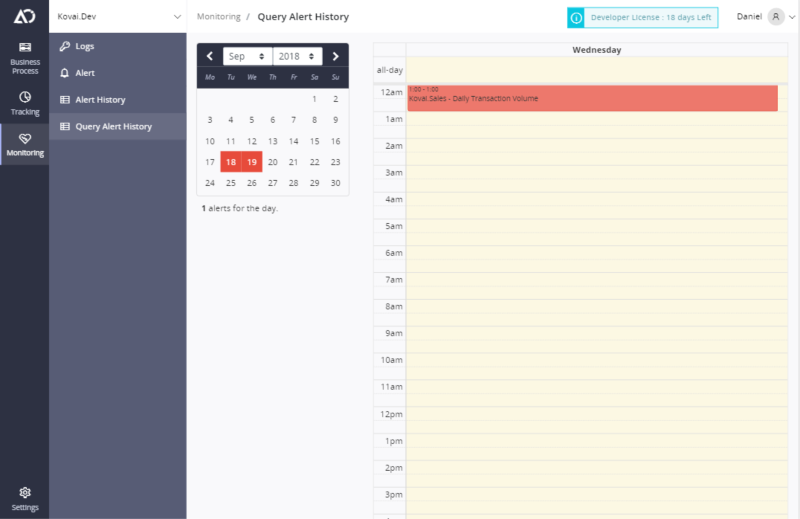
Once you save your alert the scheduler service will pick it up from the database and calculate its next execution time. You can preview all your configurations on the grid together with the next executions. You can change schedules at any time, the scheduling service will calculate the new execution date.
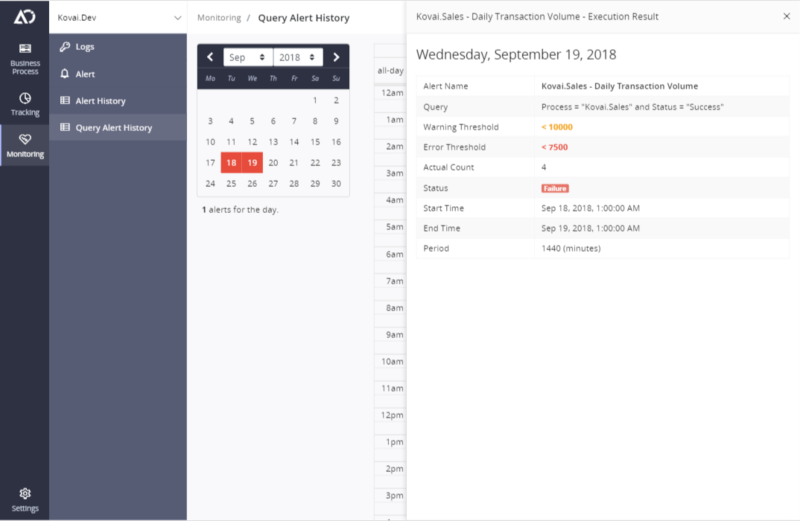
Parallelly, the monitoring service is running in the background, checking for any query alert that needs to be executed. When a configuration is found, the monitoring service executes the query and collect the total count of the query results. It then proceeds to validate it against the threshold values and adds the execution results to “Query Alert History”.
Notifications
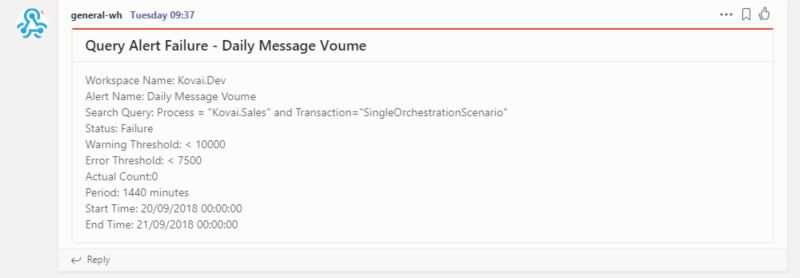
The monitoring service will generate a notification when threshold values violation. Then, send it off to all the channels that were mapped to that configuration. The notification will contain all the key information about the execution and its results. The information can be utilized to identify a problem or used as a business report.
Summary
Thanks to Atomic Scope, you can now easily monitor your SLAs and ensure that your integrations are working as expected. The wide range of notification channels ensures that notification will be spotted immediately, thus getting a faster response. The improvements are greatly impacted by customer feedback, therefore, if query alert is missing something you need do let us know at support@atomicscope.com