Atomic Scope is a functional end to end monitoring and tracking product for Azure Integration services. It not only helps the functional support professionals in finding failed transactions but also provides useful metrics on the business processes to Business users and stakeholders.
Atomic Scopes Analytics feature is popular as it helps users to create their dashboards and create custom widgets with data of their interest.
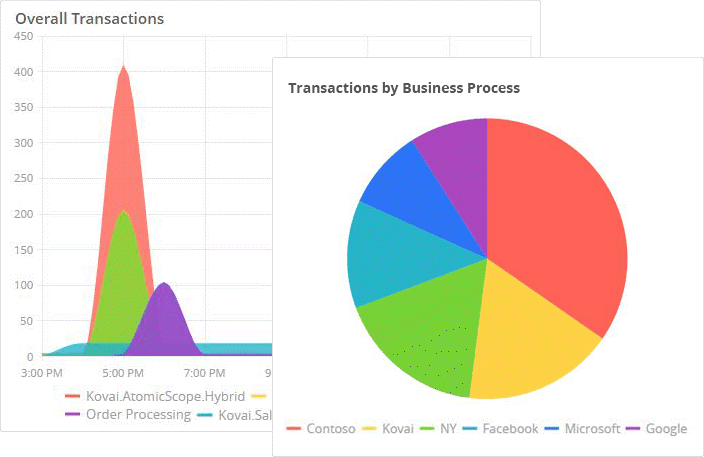 However, the business stakeholders are becoming more and more savvy to Power BI dashboards. They want to see all the data into the Power BI. They might be interested in transforming the tracked data, create some measures and hierarchies for the data being tracked in Atomic Scope.
Good news is Atomic Scope exposes the APIs which allow users to bring Atomic Scope tracked data into Power BI and build their transformations and visualizations. In this article, I explain building some basic visualizations using atomic scope data.
Scenario
To demonstrate using Power BI we are going to consider a Sales Process called MIUG.SalesProcess. This sales process is shipped as a sample as part of Atomic Scope SDK. The business process has a transaction named Purchase Order which processes purchase orders from different European countries. The flow of the transaction is as below.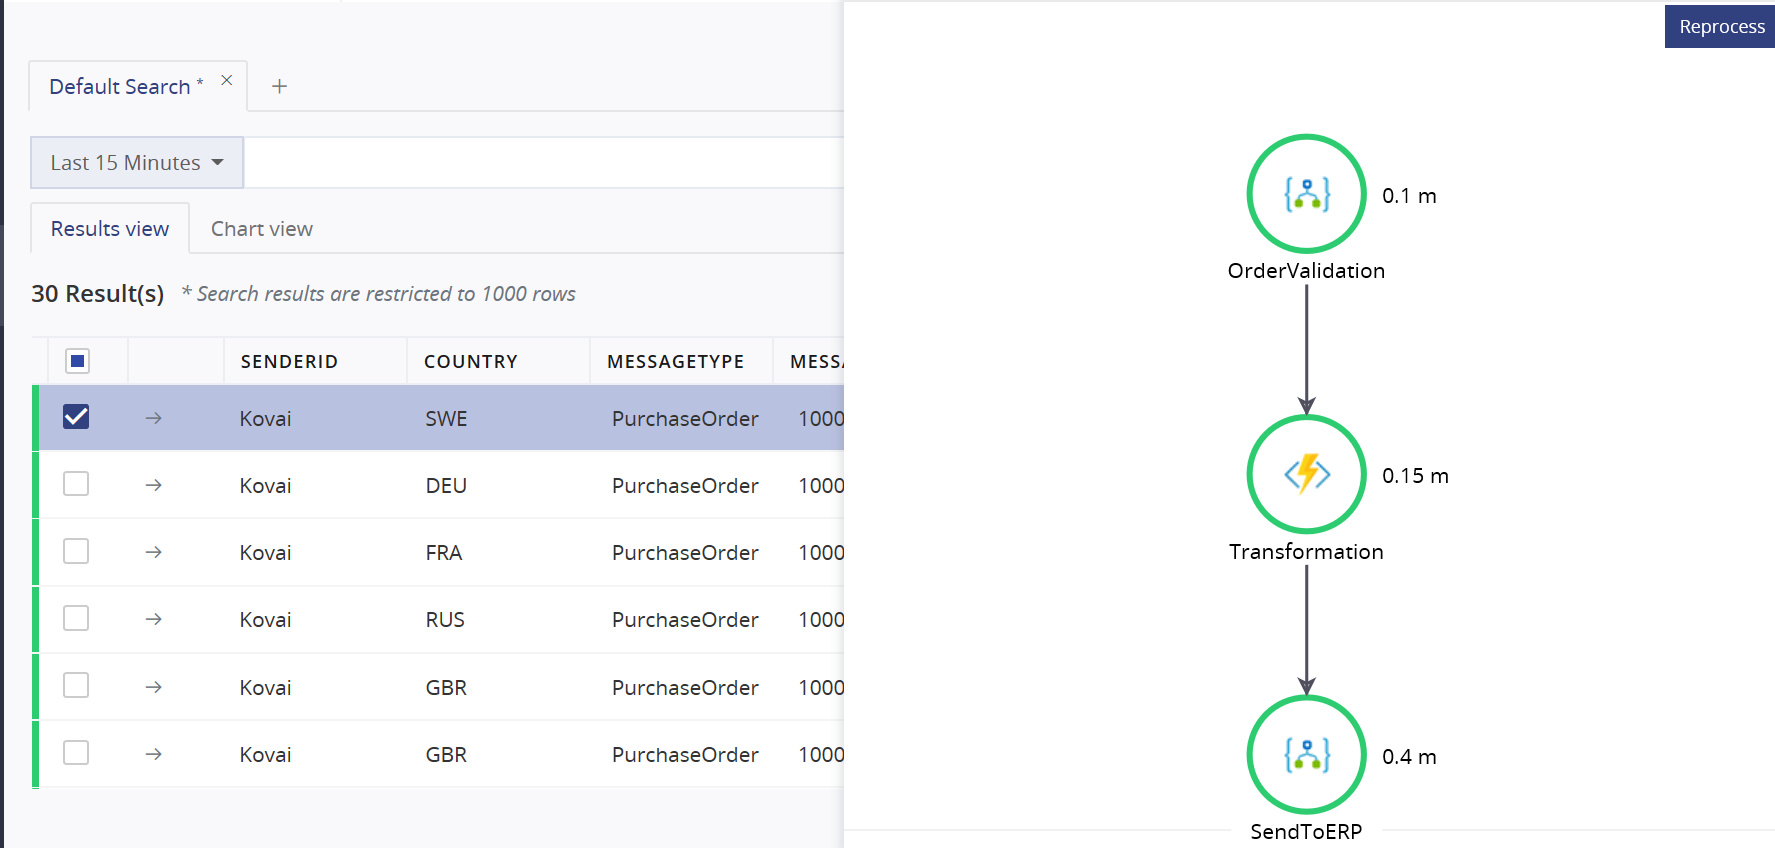
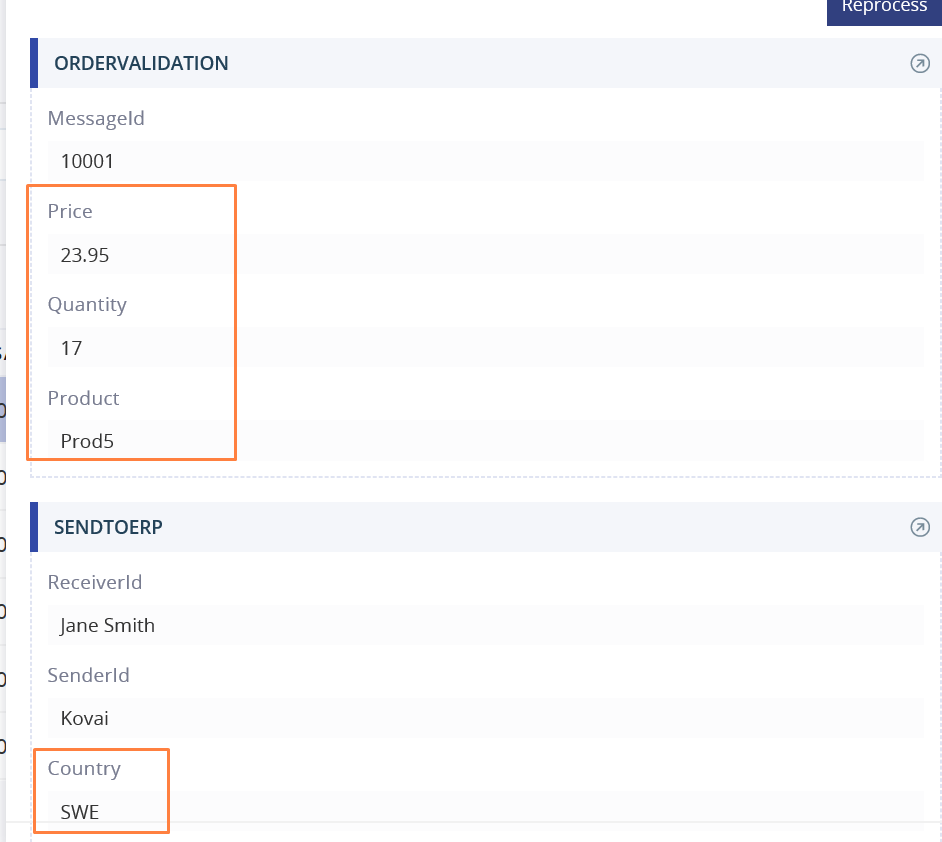
In this transaction, we are tracking data fields such as Country, Product and the Quantity in different stages.
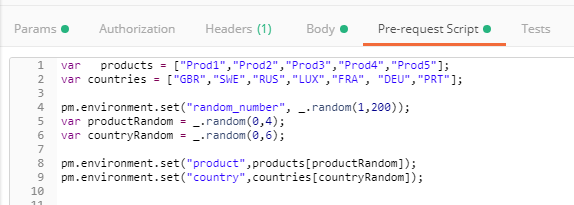
I am generating random data by posting a message from the postman and using Pre-Request Scripts.
Atomic Scope Activity APIs
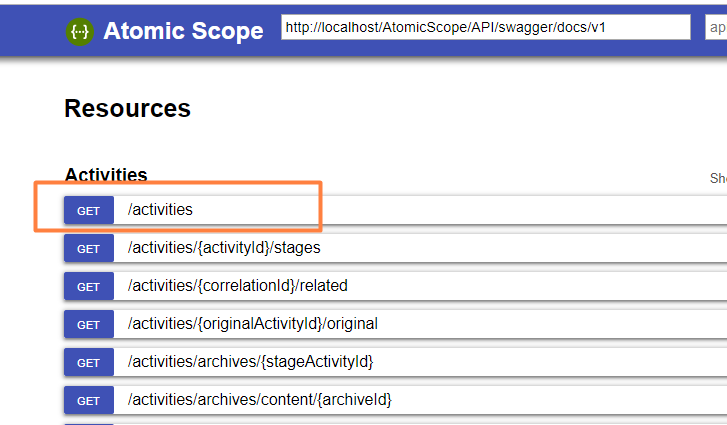
Atomic Scope exposes the APIs to access the tracked activities. Please refer to the swagger file which is available along with the product http://localhost/AtomicScope/API/swagger/ui/index#!/Activities/Activities_Get.
Get data into Power BI
Power BI has an option to import the data from the Web. Here I am assuming that user has already installed Power BI on-premises and has some basic level of understanding on Power BI usage.
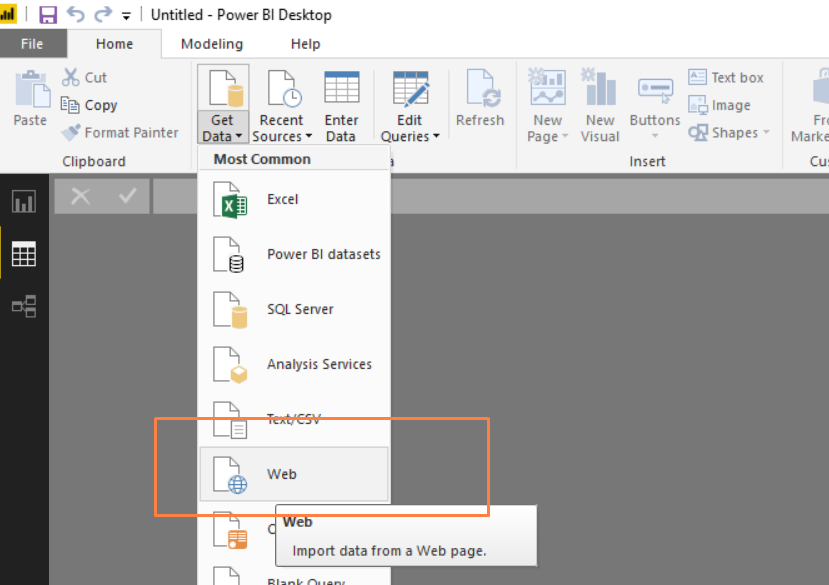
Open the Power BI on-premises and from the Home ribbon, click Get Data and select Web as shown in the picture below.
In the From Web box, provide the URL for activities API as below.
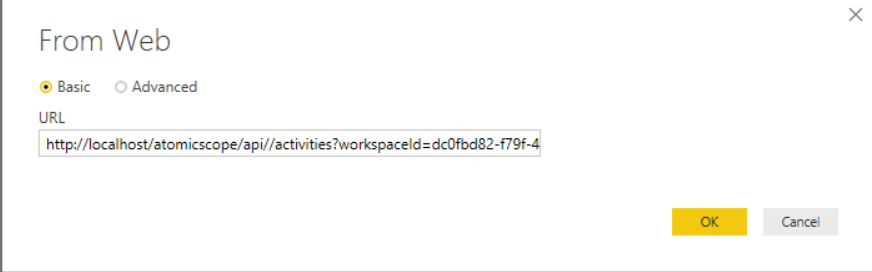
The query gets all the activities from the Purchase Order transaction in MUIG.SalesProcess which are processed in the last six hours.
Converting Global properties to the table
The API returns a list of JSON records each corresponding to a purchase order transaction end to end activity. Power BI provides an option to convert JSON records to columns.
First of all, I will start by renaming the query to AS_Actvities. As explained the data will be a list of activity records. Click on the List to show all the records into it.
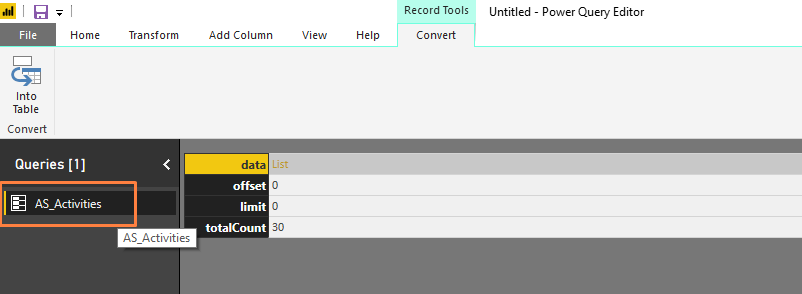
As you can see in the picture below there are around thirty activity records each of which represents a single transaction activity. From the ribbon, click on the option to To Table option.
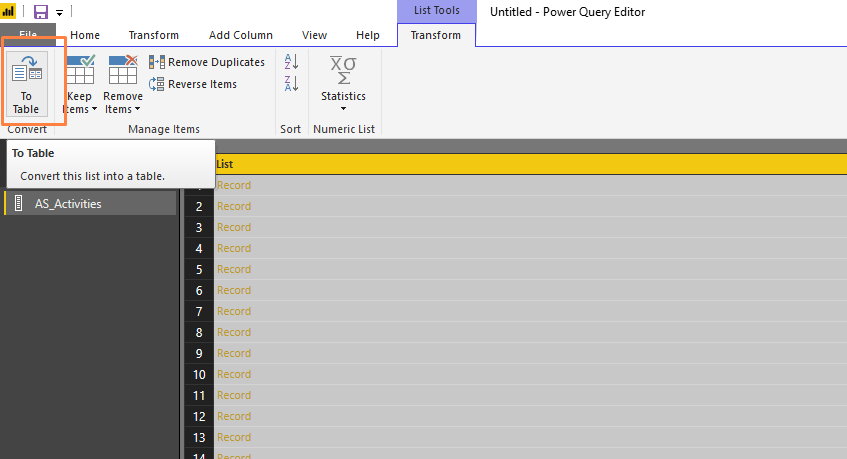
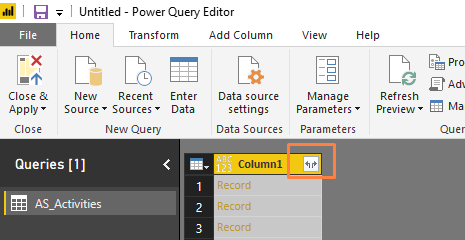
To Table option creates a database column with all JSON records. You can expand it to individual columns by clicking on the expand option as shown in the picture below.
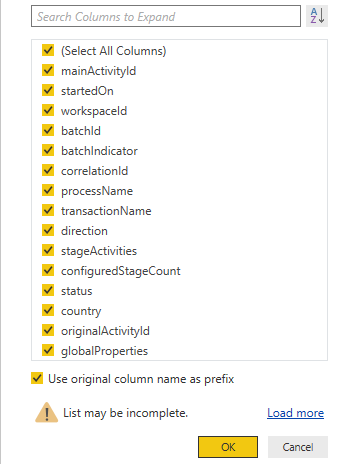
Choose all the main activity table fields as shown below.
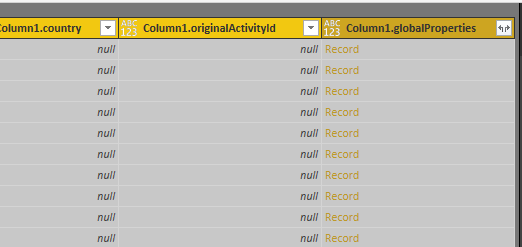
The country field is a global property. Hence, we also need to convert globalProperties JSON record to columns. Click on Close and Apply from the ribbon.
Visualization for the number of orders by Country
In previous steps, we extracted the data from the API and converted to various columns containing global properties. In this section, we will create a stacked column and Filled Map chart for Number of orders based on the Country.
Stacked Column Chart
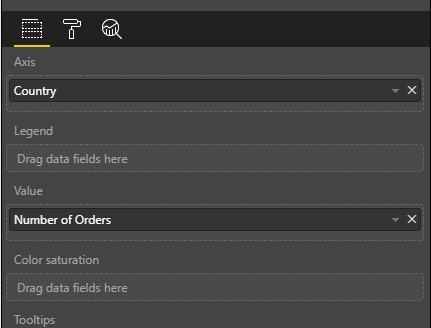
On the report section, bring a stacked column chart. In the Axis filed drag the Country field from global properties. In the value, field drags the MainActivityId which is unique to individual records.
The Graph provides the visualization of the number of orders from different countries as below.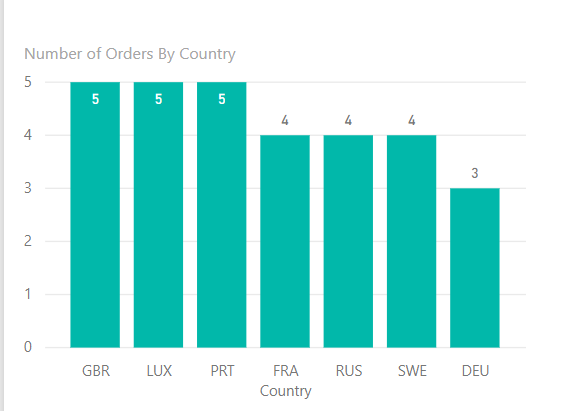
Filled Map Visualization
The same metric if we want to see it in a Filled Map visualization, follow the below steps.
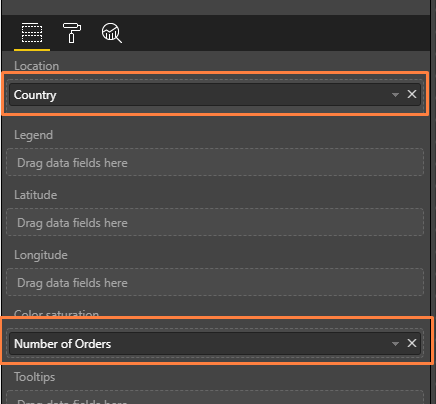
On the report section, bring a Filled Map graph. In the properties drag Country field into the location. In the color saturation, drag Main Activity Id which can be renamed to Number of Orders.
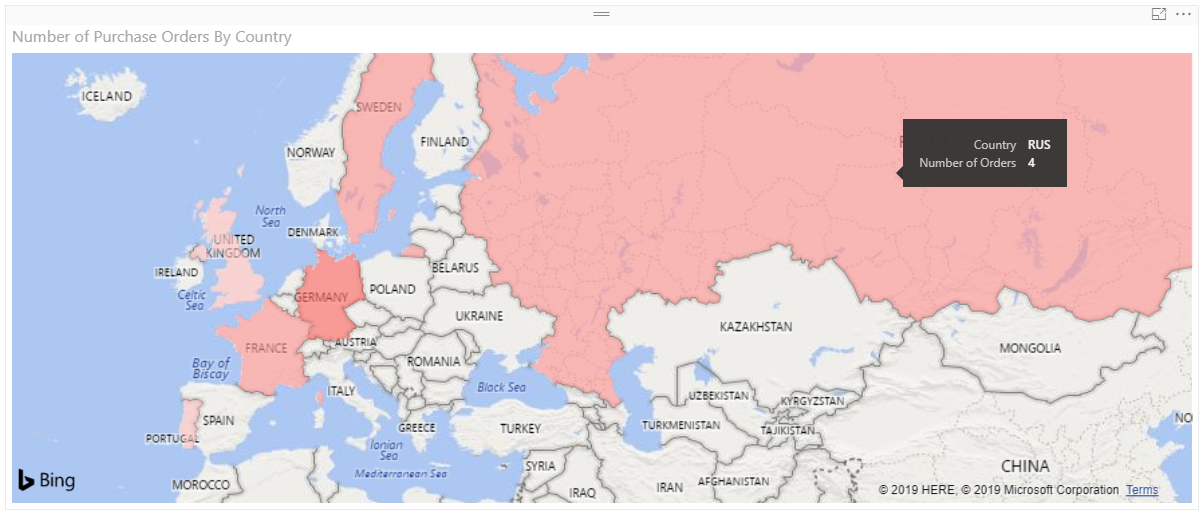
The visualization of the number of orders based on the country code looks as below.
Converting stage properties to columns
Atomic Scope allows the user to track data at different stages of a transaction. These values are stored as tracked properties into stage activities. To make these tracked data available in Power BI we need to convert the JSON structure to columns.
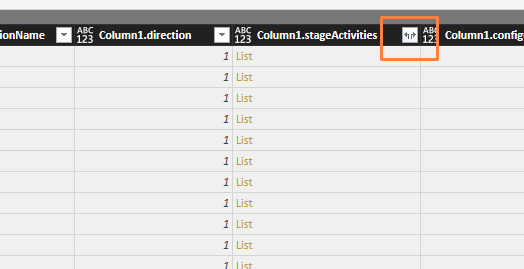
Expand the column1.StageActivities column as shown below.
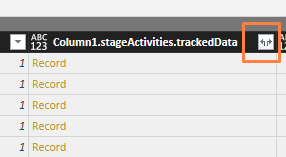
From the available columns expand the Column1.stageActivities. trackedData column.
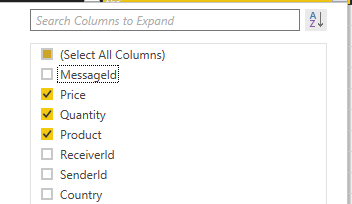
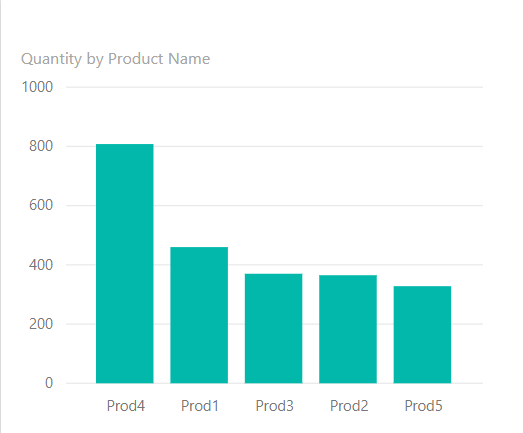
Since I am interested in finding the number of products sold based on the Product Name, I am choosing the Price, Quantity and Product fields.
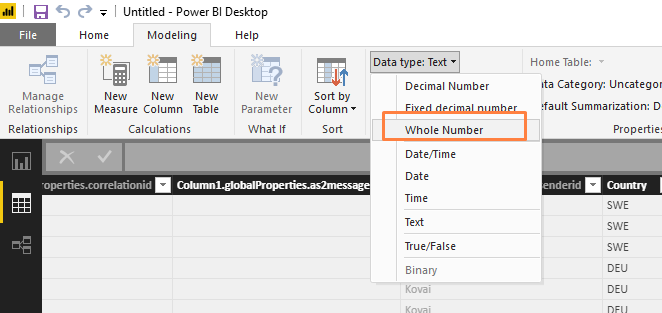
However, the quantity field will be of text type which needs to be converted to the Whole Number as shown below.
In the report section, drag a column stack chart and specify the quantity in the value section and Product Name in the axis. We will get visualization as below.
Summary
In this blog post, we looked into creating visualizations from Atomic Scope Global and Stage properties. From the blog, it is clear that Atomic Scope users will be able to transform the data further and build visualizations as per the needs of the business users. Hence we say Atomic Scope loves Power BI and its users.
Atomic Scope is a functional end to end business activity tracking and monitoring product for Hybrid integration scenarios involving Microsoft BizTalk Server and Azure Logic Apps. Try Atomic Scope free for 15 days!